Do you know how productive your field service technicians are? There’s a direct relationship between technician productivity and the bottom line profitability of your company. If you’re not tracking your technicians’ performance and discovering how productive they are, then you’re missing out on valuable savings opportunities.
Why You Need to Measure Technician Productivity
Some field service business owners focus solely on a technician’s wage when they determine how much it costs the company to bring someone on. However, that expensive but experienced technician could end up saving you a lot of money in the long term.
For example, when you bill a job at an estimated three hours, an experienced technician might complete it in two, while a less adept worker could take five hours to finish the job. You end up losing money on the latter employee, from the extra three hours of wages they got paid to the inability to send them to another job site until they complete the task.

Technician productivity numbers also give you the opportunity to gauge your workers’ effectiveness in the field and their development over time. If employees have rapidly decreasing productivity numbers, you can proactively step in to determine what the issue is. They might not have the right tools for the job or have suffered an injury that makes it difficult to keep up with the workload.
Field Service Metrics to Track
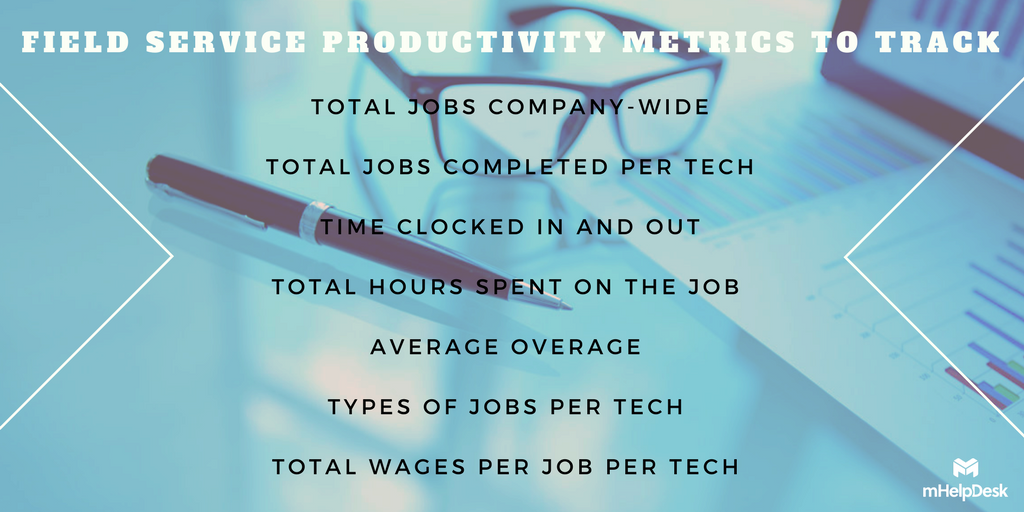
Here are a few field service metrics you can use to track productivity as well as why they help you get accurate insights into your technicians’ performance.

- Total jobs company-wide: You start with a look at how many home service jobs you had in a given period, such as a week or a month.
- Total jobs completed per tech: This metric breaks down how many jobs an individual tech handled during that same time frame.
- Time clocked in and out: You get information on how long the technician spent on jobs, which you can look at as an overall number and an individual basis.
- Total hours spent on the job: View how many hours the technician was working during the period.
- Average overage: You compare the hours that a technician spent on the job versus the hours that they are expected to complete the job in. Technicians with significant overages have poor productivity. If all technicians have large numbers in this area, reexamine your billed hours for a particular type of job.
- Types of jobs per tech: This metric categorizes the common job types for a particular contractor.
- Total wages per job per tech: You see exactly how much you’re paying a technician for the job, and you can compare this number to the amount that’s actually billed to the client.
Benefits of Using Field Service Programs for Technician Accountability
Tracking all of this information by hand or on spreadsheets adds a lot of administrative overhead to your already busy day. Luckily, you can use field service programs that handle the reporting and tracking for you.
mHelpDesk comes with staff productivity reporting, including running many of the metrics mentioned above, delivering significant value for service companies. You can quickly check the reports in your account for total jobs per staff, total jobs completed per staff, total hours spent on a job, time clocked in and out, even the GPS location history of your techs and get a gauge of who are your star performers, along with your bottom performers. Having this data will allow you to identify training opportunities and times when you have to take disciplinary action on a team member or team.

Staff productivity reporting gives you an objective view of your technician performance and productivity, and helps ensure that your techs are working to the best of their abilities, which in turn will influence your business’ bottomline. Learn more here.
![]() Login to your mHelpDesk account now to see your reports >>
Login to your mHelpDesk account now to see your reports >>
Not a mHelpDesk Customer? Get a free live demo to learn more about our reporting features and more!

Last modified: May 2, 2018


